(definition)
Definition: A visual depiction of membership in sets according to binary properties, using overlapping ovals to divide the plane into regions. Regions inside an oval have the property the oval represents, while regions outside it do not have the property. Regions are shaded to show combinations of properties (or sets) of interest, or elements are placed in regions corresponding to their properties (or membership).
See also Karnaugh map.
Note:
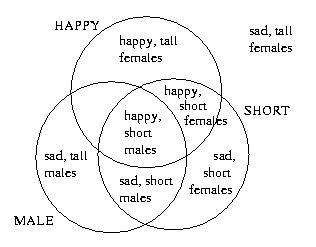
Here is an example of a Venn diagram with three properties: male/female, happy/sad, and short/tall. Some of the combinations, such as sad, tall males and happy, short females are labeled.
John Venn first published these diagrams in 1880, although similar diagrams were used much earlier by Leibniz and Euler (Opera Omnia), a century earlier.
Author: PEB
Formal definition and methods to draw diagrams for N variables.
If you have suggestions, corrections, or comments, please get in touch with Paul Black.
Entry modified 3 August 2009.
HTML page formatted Mon Feb 2 13:10:40 2015.
Cite this as:
Paul E. Black, "Venn diagram", in
Dictionary of Algorithms and Data Structures [online], Vreda Pieterse and Paul E. Black, eds. 3 August 2009. (accessed TODAY)
Available from: http://www.nist.gov/dads/HTML/venndiagram.html